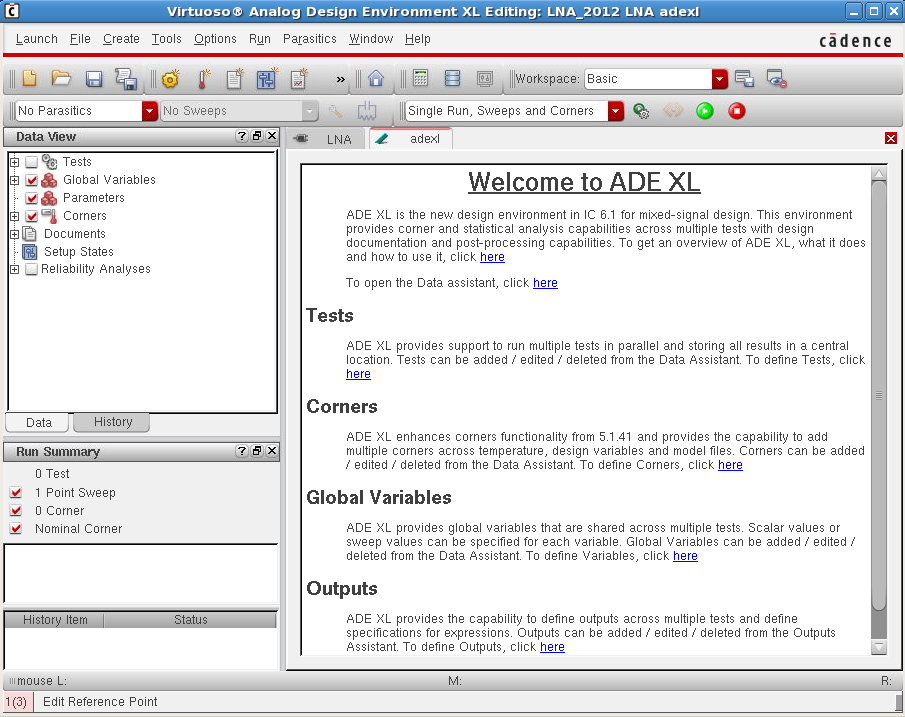
MonteCarlo Simulations using ADE XL
In this tutorial a test bench to perform STB and DC analysis of an Operational Transconductance Amplifier (OTA) is used to describe the set-up for Monte Carlo Simulations using ADE XL.
Set-up
- Test Bench Set-up
- Set-up test bench for simulations of interest using ADE L. stb and dc- operating point analyses selected for this tutorial.
- Add output variables to be plotted or evaluated. Gain, Phase, Phase Margin, Phase Margin Frequency, DC Gain and input referred offset voltage selected for the example.
- Run simulations to make sure the circuit works as expected in the nominal corner.
- Ensure the model files with statistical models are included in the Model Libraries while saving the state file.For the IBM cmrf8sf process, ensure design.scs and allModels.scs are included. Ensure that the simulator specified for the tests is spectre.
- Save the state of the simulation.

- Launch ADE XL
- Add Test bench to ADE XL
- Click Add Test in the Data View window under Tests. Choose design and ADE XL Test Editor Window would pop up.
- Select the current schematic in Choose design window.
- Load the state from Step 1 in the ADE XL Test Editor window from session menu in the toolbar. You should see the output variables loaded in ADE XL tab.
- Ensure that the Plot check box is selected for the output expressions that are desired to be evaluated. Ensure that the Nominal corner is checked in the Corners option.

- Monte Carlo Simulation Set-up
- Select Monte Carlo Sampling from the Select a Run Mode drop-down list on the Run toolbar.
- Click Simulations Options on the Run toolbar.
 .The Monte Carlo Form Window appears.
- Monte Carlo Form Window Settings
- Statistical Variations: Choose All to select both process statistical variations and mismatch (per-instance) statistical variations
- Number of points: Enter the number of Monte Carlo points to simulate. 200 chosen for this example.
- Sampling method: Choose Random. To choose other methods and to use “Auto Stop Using Significance Test” refer to ADEXL document.
- Optional: Check Save Process Data and Save Mismatch Data to save data in the results database for later viewing.
- Other options: Check Run Nominal Simulation to make spectre check for convergence errors using a nominal simulation. If errors are encountered then Monte Carlo analysis is stopped
- Check Save Data to Allow Family Plots. This would plot a family of Gain and Phase curves for our circuit. To specify a different seed for the Monte Carlo analysis, select the Monte Carlo Seed check box and type the seed number. By always specifying the same seed, you can reproduce a previous experiment. To specify a starting run number, select the Starting Run No. checkbox and type the starting run number. The starting run number specifies the run that Monte Carlo begins with. By specifying this number, you can reproduce a particular run or sequence of runs from a previous experiment. These fields left blank for our example.
- By default, mismatch variations are applied to all sub-circuit instances in the design. Click the Specify Instances/Devices button to specify the sensitive instances and devices to either include or exclude for applying mismatch variations.
- Hit OK after making desired changes. Click Run Simulation from the Run toolbar.
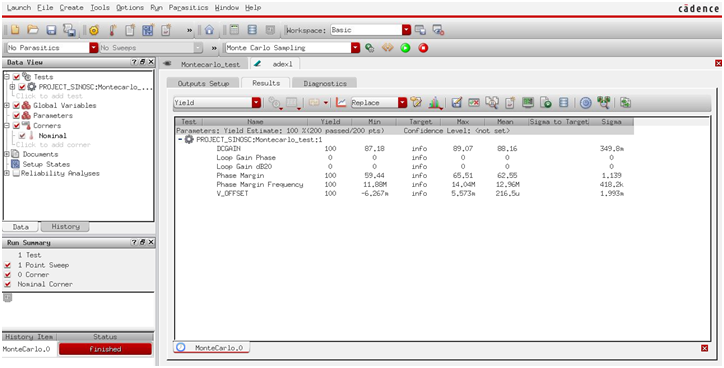
On completion of 200 Runs, the results are displayed in the Yield view on the Results tab of the Outputs pane. Results are reported for each test and measurement expression and the total yield is reported for the circuit.
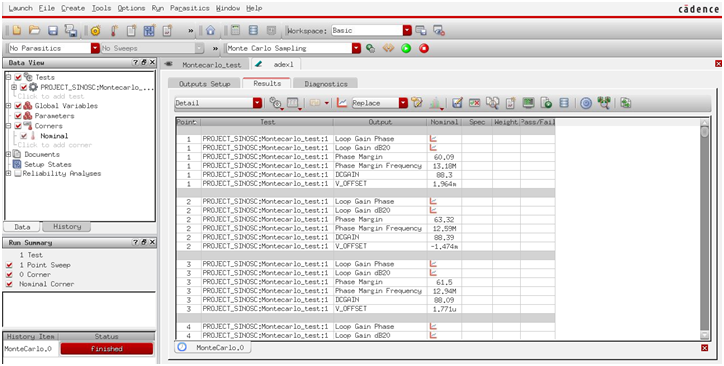
Choose the Summary view or the Detail view on the Results tab to view Summary of the results or detailed results for the Monte Carlo analysis. Below is the Detail View.
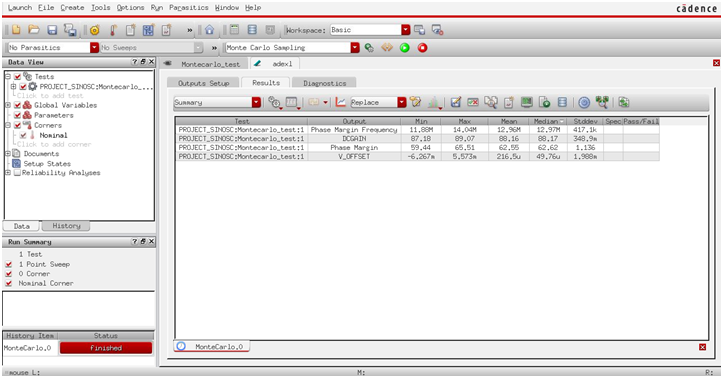
Below is the Summary View.
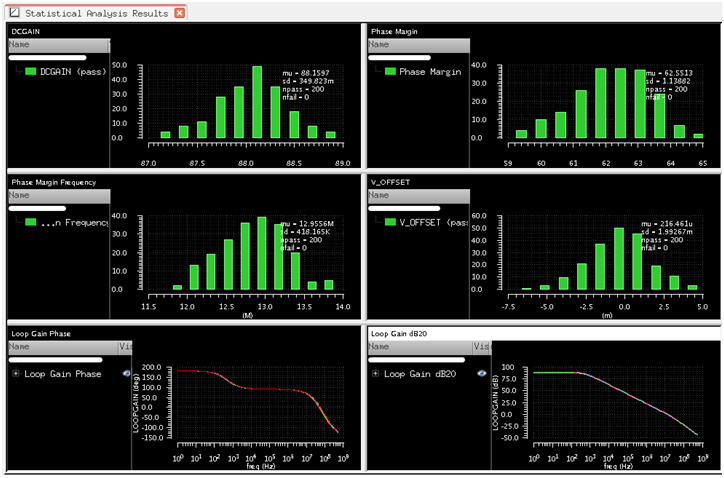
Click the plot ![]() button to plot the histogram of the scalar variables and to plot a family of curves for Gain and Phase. The plots are shown below.
button to plot the histogram of the scalar variables and to plot a family of curves for Gain and Phase. The plots are shown below.
The ADE XL view can be saved similar to saving a schematic or a layout in the Library manager with the desired tests added.
