Team Slytherin: Difference between revisions
Jump to navigation
Jump to search
| Line 136: | Line 136: | ||
gprof -b -z a.out >result.txt | gprof -b -z a.out >result.txt | ||
The output of gprof: | The output of gprof: | ||
The link [http://www.cs.utah.edu/dept/old/texinfo/as/gprof.html#SEC5] explains on how to understand a Flat Profile. | |||
====Flat profile==== | ====Flat profile==== | ||
| Line 160: | Line 160: | ||
====Call graph==== | ====Call graph==== | ||
The link [http://www.cs.utah.edu/dept/old/texinfo/as/gprof.html#SEC6] explains on how to read the call graph. | |||
granularity: each sample hit covers 2 byte(s) for 33.23% of 0.03 seconds | granularity: each sample hit covers 2 byte(s) for 33.23% of 0.03 seconds | ||
index % time self children called name | index % time self children called name | ||
Revision as of 21:04, 22 February 2012
Team Members
- Kevin Townsend
- Bhavani Satyanarayana Rao
- Chidvila Gaddam
Assignment1
Running the sample application with script files
- The runcp script located in the SampleAppVadd can be used to run the application in HW which sets the appropriate environment variables and runs the UserApp.exe export CNY_PDK_PROJ = ~/pdk_sample/cae_pers_vadd ./runcp
- The run script located in the SampleAppVadd can be used to run the application in SW
- The scripts above can be used to run the application on Simulator using the "-vsim" option which sets the environment variable CNY_CAE_EMULATOR to ./run_simulation ./runcp -vsim or ./run -vsim
| Environment Variables | Software | ModelSim | Hardware |
|---|---|---|---|
| CNY_SIM_THREAD | libcpSimLib2.so | libcpSimLib2.so | unset |
| CNY_CAE_EMULATOR | <location for CaeSimPers> | ./run_simulation | unset |
Changes made to run the application on ModelSim
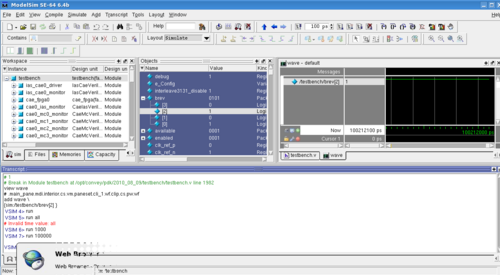
- Setup as explained in here [[1]]
- Set the CNY_PDK_PROJ environment variable to the location of cae_pers_vadd export CNY_PDK_PROJ = ~/pdk_sample/cae_pers_vadd
- Copied Jones' my_makefile from the temp dir and replaced the makefile in CY_PDK_PROJ/testbench
- Add line to the makefile in testbench dir CNY_PDK_MODELSIM_USER_SIM_OPTIONS= -i -do "run -all"
- Modify the values of LIB_DIR and LDFLAGS from 32-bit to 64-bit as given below LIB_DIR = lib64 LDFLAGS = -m64
Extra Credit: Exploring gdb
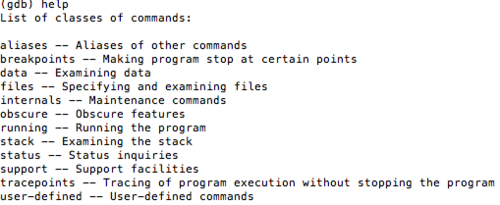
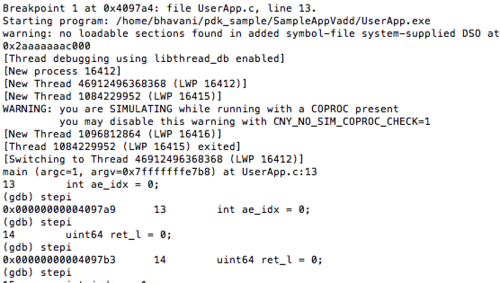
- We invoked gdb using the gdb <programname> command or by using the run/runcp script files in with "-gdb" option gdb UserApp.exe or ./run -gdb
- One can find different command classes on gdb by typing help.To get details on a particular command class/command, type help on gdb followed by the name of the command class/command
- We explored some commands like run, start (to begin execution), stepi (for single instruction stepping into a file), kill (kill a running program) and quit on gdb


Assignment2
About Sobel Algorithm
Sobel Algorithm is used for edge detection in image processing.The link[2] explains
- Why edge detection is important?
- How sobel algorithm uses the gradient method (jump in the pixel values along edges in the images compared to the pixels around it) to detect edges in images?
The Algorithm
- Use Sobel masks to find the gradient of a pixel w.r.t its 8 immediate neighboring pixel values. The Sobel masks are GX={(-1,0,+1),(-2,0,+2),(-1,0,+1)) which gives the gradient in the x direction and Gy={(+1,+2,+1),(0,0,0),(-1,-2,-1)} which gives the gradient in the x direction.
- Find the approximate magnitude of the gradient using the formula |G|=|Gx|+|Gy|
- Compare |G| against the threshold values (0 and 255 in our case). If (|G| > 255) then the pixel value is 0 in the output image. If (|G| < 0) then the pixel value is 255 in the output image.
- Repeat the above steps for all the pixels in the image
C code for Sobel Algorithm
Source: Edge Detection Tutorial-Author: Bill Green (2002)[3]
 for(Y=0; Y<=(originalImage.rows-1); Y++)  {
       for(X=0; X<=(originalImage.cols-1); X++)  {
            sumX = 0;
            sumY = 0;
            /* image boundaries */
            if(Y==0 || Y==originalImage.rows-1)
                 SUM = 0;
            else if(X==0 || X==originalImage.cols-1)
                 SUM = 0;
            /* Convolution starts here */
            else   {
              /*-------X GRADIENT APPROXIMATION------*/
              for(I=-1; I<=1; I++)  {
                  for(J=-1; J<=1; J++)  {
                     sumX = sumX + (int)( (*(originalImage.data + X + I + (Y + J)*originalImage.cols)) * GX[I+1][J+1]);
                  }
              }
              if(sumX>255)  sumX=255;
              if(sumX<0)    sumX=0;
              /*-------Y GRADIENT APPROXIMATION-------*/
              for(I=-1; I<=1; I++)  {
                  for(J=-1; J<=1; J++)  {
                      sumY = sumY + (int)( (*(originalImage.data + X + I + (Y + J)*originalImage.cols)) * GY[I+1][J+1]);
                  }
              }
              if(sumY>255)   sumY=255;
              if(sumY<0)     sumY=0;
              SUM = abs(sumX) + abs(sumY); /*---GRADIENT MAGNITUDE APPROXIMATION (Myler p.218)----*/
            }
            *(edgeImage.data + X + Y*originalImage.cols) = 255 - (unsigned char)(SUM);  /* make edges black and background white */
            fwrite( (edgeImage.data + X + Y*originalImage.cols), sizeof(char), 1, bmpOutput);
Profiling C code Using gprof
Compile the c code with -pg option
gcc -pg -lm edgesob.c
Run the a.out file
./a.out lena.bmp
Execute the gprof command, provide it with the executable file name and pipe the output to a text file. Note the use of -z option.Unless the `-z' option is given, functions with no apparent time spent in them, and no apparent calls to them, are not mentioned. source:The GNU Profiler-Jay Fenlason and Richard Stallman[4]
gprof -b -z a.out >result.txt
The output of gprof: The link [5] explains on how to understand a Flat Profile.
Flat profile
 Each sample counts as 0.01 seconds.
   %   cumulative   self              self     total
  time   seconds   seconds    calls  Ts/call  Ts/call  name
 100.31      0.03     0.03                             main
 0.00      0.03     0.00        4     0.00     0.00  getImageInfo
 0.00      0.03     0.00        1     0.00     0.00  copyColorTable
 0.00      0.03     0.00        1     0.00     0.00  copyImageInfo
 0.00      0.03     0.00                             __do_global_ctors_aux
 0.00      0.03     0.00                             __do_global_dtors_aux
 0.00      0.03     0.00                             __gmon_start__
 0.00      0.03     0.00                             __libc_csu_fini
 0.00      0.03     0.00                             __libc_csu_init
 0.00      0.03     0.00                             _fini
 0.00      0.03     0.00                             _init
 0.00      0.03     0.00                             _start
 0.00      0.03     0.00                             atexit
 0.00      0.03     0.00                             call_gmon_start
 0.00      0.03     0.00                             data_start
 0.00      0.03     0.00                             frame_dummy
Call graph
The link [6] explains on how to read the call graph.
 granularity: each sample hit covers 2 byte(s) for 33.23% of 0.03 seconds
 index % time    self  children    called     name
                                                <spontaneous>
 [1]    100.0    0.03    0.00                 main [1]
                 0.00    0.00       4/4           getImageInfo [2]
                 0.00    0.00       1/1           copyImageInfo [4]
                 0.00    0.00       1/1           copyColorTable [3]
 -----------------------------------------------
                 0.00    0.00       4/4           main [1]
 [2]      0.0    0.00    0.00       4         getImageInfo [2]
 -----------------------------------------------
                 0.00    0.00       1/1           main [1]
 [3]      0.0    0.00    0.00       1         copyColorTable [3]
 -----------------------------------------------
                 0.00    0.00       1/1           main [1]
 [4]      0.0    0.00    0.00       1         copyImageInfo [4]
 -----------------------------------------------
                                                  <spontaneous>
 [7]      0.0    0.00    0.00                 atexit [7]
 -----------------------------------------------
                                                  <spontaneous>
 [8]      0.0    0.00    0.00                 call_gmon_start [8]
 -----------------------------------------------
                                                  <spontaneous>
 [9]      0.0    0.00    0.00                 data_start [9]
 -----------------------------------------------
                                                  <spontaneous>
 [10]     0.0    0.00    0.00                 frame_dummy [10]
 -----------------------------------------------
                                                  <spontaneous>
 [11]     0.0    0.00    0.00                 __do_global_ctors_aux [11]
 -----------------------------------------------
                                                  <spontaneous>
 [12]     0.0    0.00    0.00                 __do_global_dtors_aux [12]
 -----------------------------------------------
                                                  <spontaneous>
 [13]     0.0    0.00    0.00                 __gmon_start__ [13]
 -----------------------------------------------
                                                  <spontaneous>
 [14]     0.0    0.00    0.00                 __libc_csu_fini [14]
 -----------------------------------------------
                                                  <spontaneous>
 [15]     0.0    0.00    0.00                 __libc_csu_init [15]
 -----------------------------------------------
                                                  <spontaneous>
 [16]     0.0    0.00    0.00                 _fini [16]
 -----------------------------------------------
                                                  <spontaneous>
 [17]     0.0    0.00    0.00                 _init [17]
 -----------------------------------------------
                                                  <spontaneous>
 [18]     0.0    0.00    0.00                 _start [18]
 -----------------------------------------------
